
The Newton-Miller-Smith extension explained (with a worked example)
A Van Westendorp survey, the popular four-question pricing survey also called the Price Sensitivity Meter (PSM), shows you the acceptable price range for your product: the prices most of your target customers don't reject as too cheap or too expensive.
What it can't tell you is which price inside that range earns the most revenue, because none of its four questions asks whether anyone would actually buy at the prices they suggest.
The Newton-Miller-Smith extension adds two purchase-intent questions to fill that gap, so the same survey also estimates how many people would buy and how much revenue you'd earn at every price.
This guide covers what the Newton-Miller-Smith extension adds to VW surveys, how it turns two answers per person into demand and revenue projections at each price point, a worked example you can check by hand, when the extension is worth the extra questions, and where its estimates are less reliable.
What is the Newton-Miller-Smith extension?
The Newton-Miller-Smith (NMS) extension is a pair of purchase-intent questions added to the end of a Van Westendorp survey, which turn the acceptable price range into an estimate of demand and revenue at each price. Purchase intent means how likely someone says they'd be to buy, and demand means the share of your target customers who would buy at a given price.
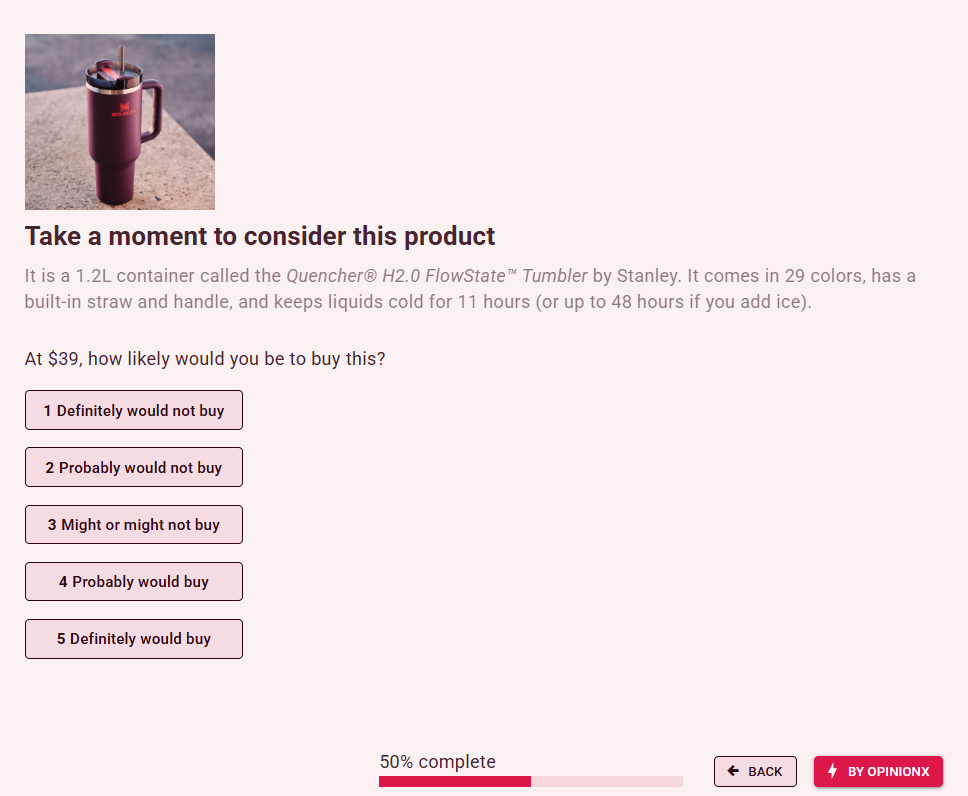
By this point, each participant has already answered the four Van Westendorp questions by typing the prices they consider too cheap, a bargain, getting expensive and too expensive. The NMS extension then shows each participant two of their own answers back to them: the first NMS question asks how likely they'd be to buy at their "bargain" price, and the second asks the same about their "getting expensive" price, both with a five-point scale that runs from ‘definitely not buying’ to ‘definitely buying’.
So why bother with two extra questions? The price that the fewest people reject isn't the price that earns the most revenue, and while Van Westendorp finds you that rejection percentage, it takes the NMS extension to find revenue result. The revenue-maximising price often sits above the price where the highest percentage of people would buy, because a higher price brings in more revenue from each buyer than you lose from the buyers who drop out, up to a point.
Newton, Miller and Smith published the extension in 1993, in a paper titled "A market acceptance extension to traditional price sensitivity measurement" for the American Marketing Association's Advanced Research Techniques Forum (citation and method notes). Peter van Westendorp's original four questions date from his 1976 paper for ESOMAR, the global market research association (ESOMAR).
How does the Newton-Miller-Smith extension estimate demand and revenue?
The Newton-Miller-Smith extension builds its estimate in three steps: it converts each answer into a purchase likelihood, draws a demand line for each participant, and then averages those lines across everyone.
Step 1: Convert each answer into a likelihood
The NMS extension turns each point on the five-point scale into a percentage chance of buying. On OpinionX, the conversion looks like this:
| Answer | Likelihood of buying |
|---|---|
| Definitely would buy | 80% |
| Probably would buy | 60% |
| Might or might not buy | 40% |
| Probably would not buy | 20% |
| Definitely would not buy | 0% |
The top answer counts as 80% instead of 100% on purpose. People say they'll buy far more readily in a survey than they do when they have to pay, so OpinionX scales every answer down first. Research on willingness to pay (the highest price someone would pay) shows that people in surveys overstate it by about 21% on average compared with actual purchases (Journal of the Academy of Marketing Science, 2020).
Step 2: Draw one demand line per participant
The Newton-Miller-Smith method gives each participant four price points with a likelihood attached. Their "too cheap" price and their "too expensive" price both count as 0%, because the method assumes a person won't buy at a price they call too cheap or too expensive. That 0% rule comes from the original method, as this open textbook walkthrough of the method shows. Their "bargain" price and their "getting expensive" price take the likelihoods from step 1, and straight lines connect all four points, which gives that participant an estimated likelihood at every price in between.
Step 3: Average the lines and multiply by price
The NMS extension then averages every participant's likelihood at each price, which produces the demand curve, the line showing what share of your target customers would buy at each price. Multiply each price by its demand and you get the average revenue per participant at that price.
The average includes everyone you surveyed, people who'd never buy as well as people who would. Dividing by everyone is what makes a $40 price and a $90 price comparable, because you measure both against the same group of people.
Worked example: pricing a pair of wireless earbuds
Want to see how the Newton-Miller-Smith calculation works? Run it by hand on a small example. Here are four participants pricing the same pair of wireless earbuds. An actual study needs far more participants than four, of course, but four is enough to check every figure yourself.
| Participant | Too cheap | Bargain | Getting expensive | Too expensive | Would buy at bargain price | Would buy at getting-expensive price |
|---|---|---|---|---|---|---|
| Participant 1 | $20 | $40 | $70 | $100 | Definitely (80%) | Might or might not (40%) |
| Participant 2 | $30 | $50 | $80 | $120 | Probably (60%) | Probably (60%) |
| Participant 3 | $15 | $30 | $50 | $60 | Definitely (80%) | Probably not (20%) |
| Participant 4 | $40 | $60 | $90 | $130 | Probably (60%) | Might or might not (40%) |
Take participant 1, who gave a bargain price of $40 and said they'd definitely buy at that price (80%), and gave a getting-expensive price of $70 and said they might or might not buy at that price (40%). Their too-cheap price of $20 and too-expensive price of $100 both count as 0%. Between $40 and $70, participant 1's likelihood falls in a straight line from 80% to 40%, so halfway, at $55, it's 60%. Between $70 and $100, it falls from 40% to 0%, so at $85 it's 20%.
Do the same for all four participants, average their likelihoods at each price, and multiply by the price:
| Price | Average purchase likelihood | Average revenue per participant |
|---|---|---|
| $30 | 30.0% | $9.00 |
| $40 | 40.0% | $16.00 |
| $50 | 44.2% | $22.08 |
| $60 | 43.3% | $26.00 |
| $70 | 38.3% | $26.83 |
| $80 | 33.3% | $26.67 |
| $90 | 24.6% | $22.12 |
| $100 | 15.0% | $15.00 |
Demand is highest at $50, where an average of 44.2% of participants would buy. Of the prices in the table, revenue is highest at $70, at $26.83 per participant, even though fewer people buy there (38.3%). That's the point from earlier, with figures: between $50 and $70, charging each buyer $20 more brings in more revenue than you lose as the share of participants buying falls from 44.2% to 38.3%.
The table also shows how flat the top of the revenue curve is. Average revenue per participant stays between $26.00 and $26.83 for every price from $60 to $80, so in this example any price in that band earns almost the same revenue. That's good to know, because it means you can pick a price in that band for other reasons (matching a competitor, say, or leaving room for a discount) without giving up revenue.
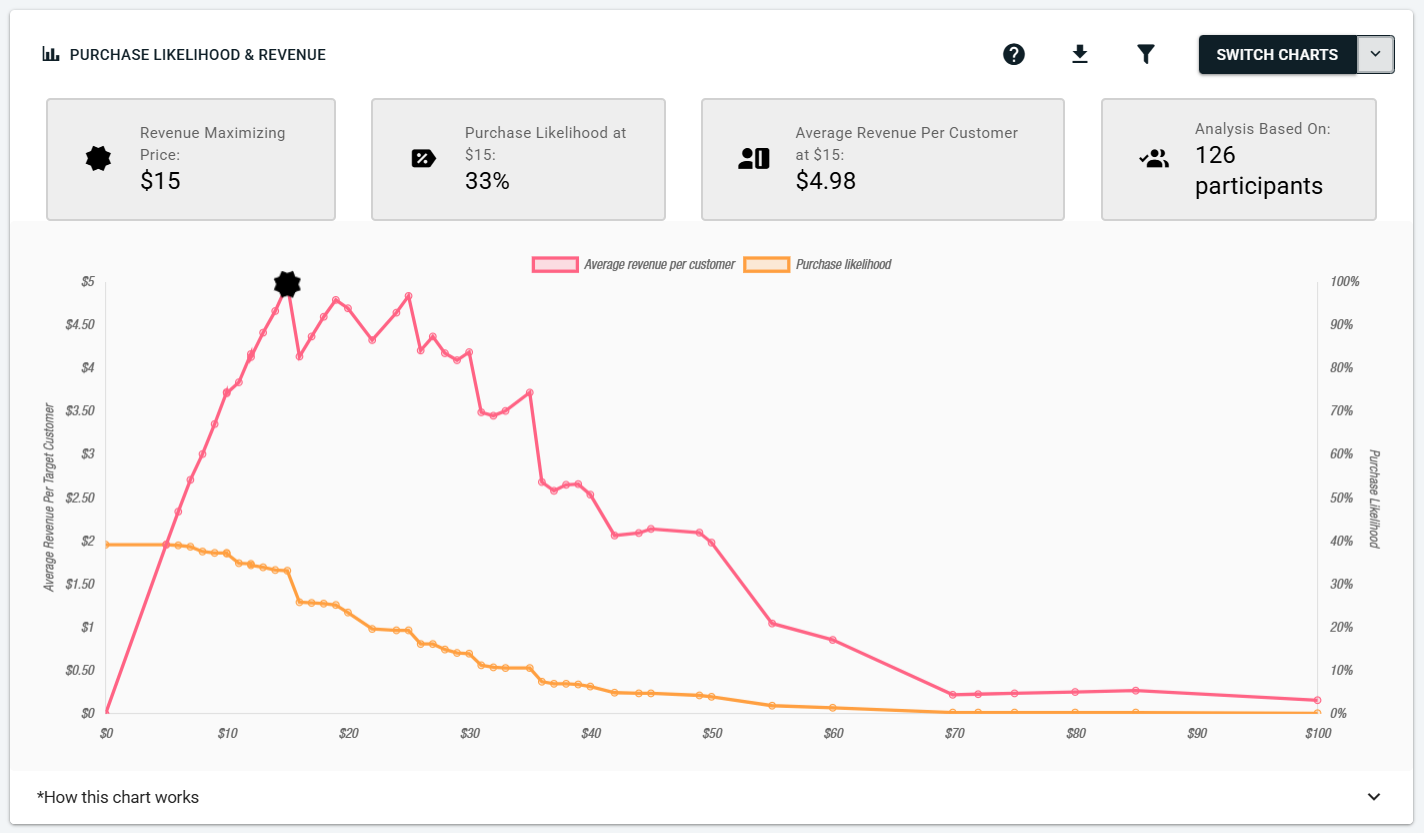
OpinionX runs this calculation for you and draws the result as the Purchase Likelihood & Revenue chart. Four callouts above the chart show the revenue-maximising price, the purchase likelihood at that price, the average revenue per customer at that price, and the number of valid participants behind the chart. Our guide How to read a Van Westendorp chart walks through both Van Westendorp charts one line at a time.
When is the Newton-Miller-Smith extension worth the extra questions?
The Newton-Miller-Smith extension only adds two questions per participant, and it's the standard way to get a revenue estimate out of a Van Westendorp survey.
✅ Revenue is part of your pricing decision, and you need to choose one price inside the acceptable price range instead of settling for the range itself.
✅ You have no price to start from, so you can't yet pick the specific prices a Gabor Granger survey needs. Gabor Granger is a pricing survey that shows each participant set prices one at a time and asks whether they'd buy at each.
✅ You want to know whether the revenue peak is sharp or flat, so you know how much room you have to move the price.
❌ You only need the acceptable price range, for example to rule out prices before a later study.
❌ You're pricing tiers or bundles. The NMS extension prices one offer at a time, so it can't tell you which features belong in which tier. A conjoint analysis survey, which asks people to choose between versions of a product, measures what each feature is worth.
Decide on the Newton-Miller-Smith extension before the survey goes live. Participants have to answer the two questions while they're taking the survey, so you can't add revenue analysis afterwards without sending the survey out again.
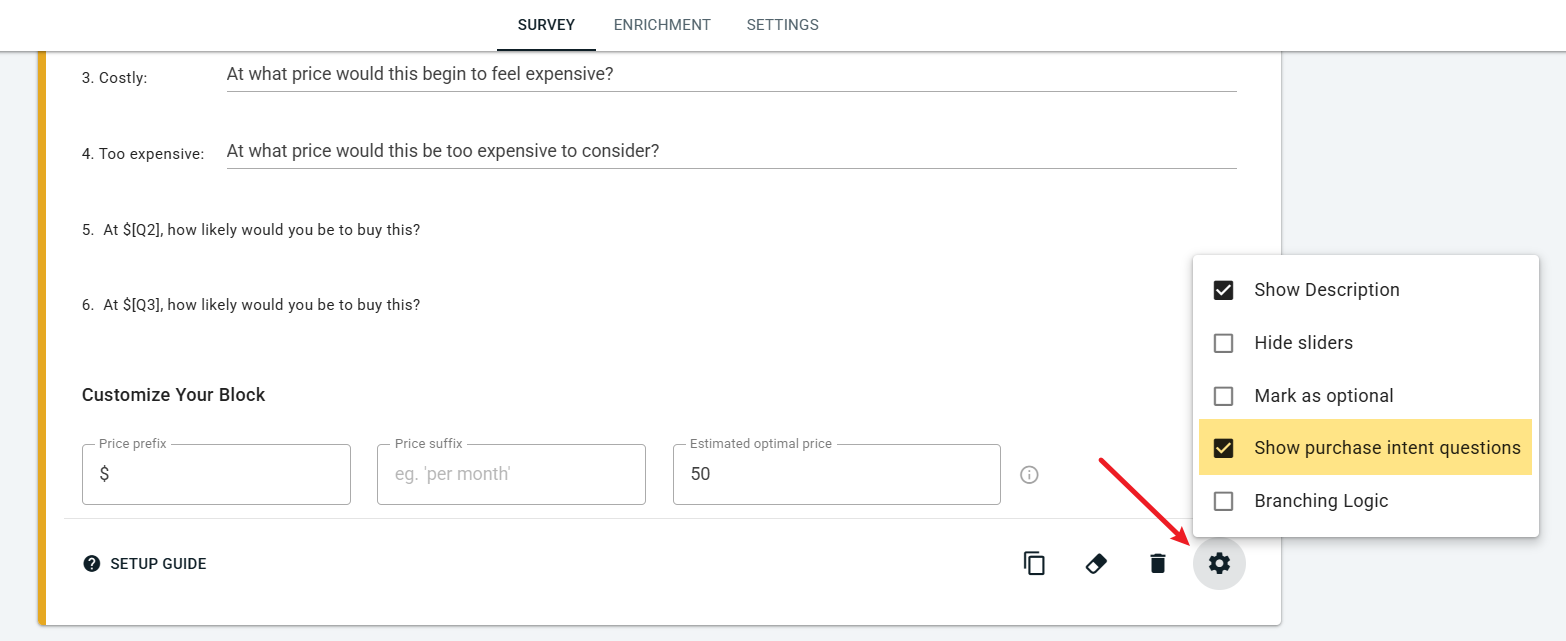
On OpinionX, the setting is a checkbox called "Show price elasticity questions" in the settings menu (the ⚙️ icon at the bottom right of the Van Westendorp question type) during survey setup. Price elasticity means how much demand drops when the price goes up, which is what the two extra questions measure. Once results come in, the Purchase Likelihood & Revenue chart sits behind the "Switch Charts" button on your Van Westendorp results.
What are the limitations of the Newton-Miller-Smith extension?
The Newton-Miller-Smith extension's weaknesses all come from the same source: it builds a full demand curve from two stated answers per person plus a set of assumptions.
The biggest one is that the step that turns answers into likelihoods rests on a choice someone made, not on anything anyone measured. OpinionX counts "Definitely would buy" as 80%. An open-source R package built for this analysis, called pricesensitivitymeter, counts it as 70%, with 50%, 30%, 10% and 0% for the answers below it (package documentation). Rerun the earbuds example with that lower scale and the revenue peak still sits at $70 among the prices in the table, but average revenue per participant at the peak drops from $26.83 to $21.58, about 20% lower. The position of the peak holds up much better than its height, so use the NMS extension to choose a price and don't use its revenue figure as a forecast.
Then there's each person's demand line. The NMS extension only measures two prices per person, so the straight lines between them are an assumption, and so is the rule that nobody buys at their too-cheap price (some people would happily buy a product they think is suspiciously cheap).
Sadly though, what people say still runs ahead of what they do, even after the 80% scaling. One review of 28 studies found that the values people state in surveys are typically about 1.35 times what they pay when actual money is involved, with a few studies far higher than that (Environmental and Resource Economics, 2005). Check the price you pick against your sales or a live price test before you treat it as final.
Finally, the Newton-Miller-Smith extension needs enough participants for the revenue peak to settle. Each participant adds only two measured points, so with a small group, a few unusual answers can move the peak by several dollars. Our Van Westendorp sample size calculator shows how many participants your study needs.
Want to compare the revenue estimate with a method that tests set prices directly? Our guide on Van Westendorp vs Gabor Granger explains when each pricing survey gives you a more exact answer. If your customers fall into groups that would pay very different prices, our guide on how to segment Van Westendorp results shows how to compare the revenue-maximising price for each customer segment. And for the full method, from writing the four questions to reading the chart, start with our Van Westendorp pricing guide.
About to run your first pricing survey with revenue analysis and want someone to check your product description, price estimate and settings before it goes out? Book a free 30-minute setup call and a research expert will walk through the survey with you, with no obligation.
The Van Westendorp question type, including the two Newton-Miller-Smith questions, is on OpinionX's free plan, with up to 25 participants per survey.
